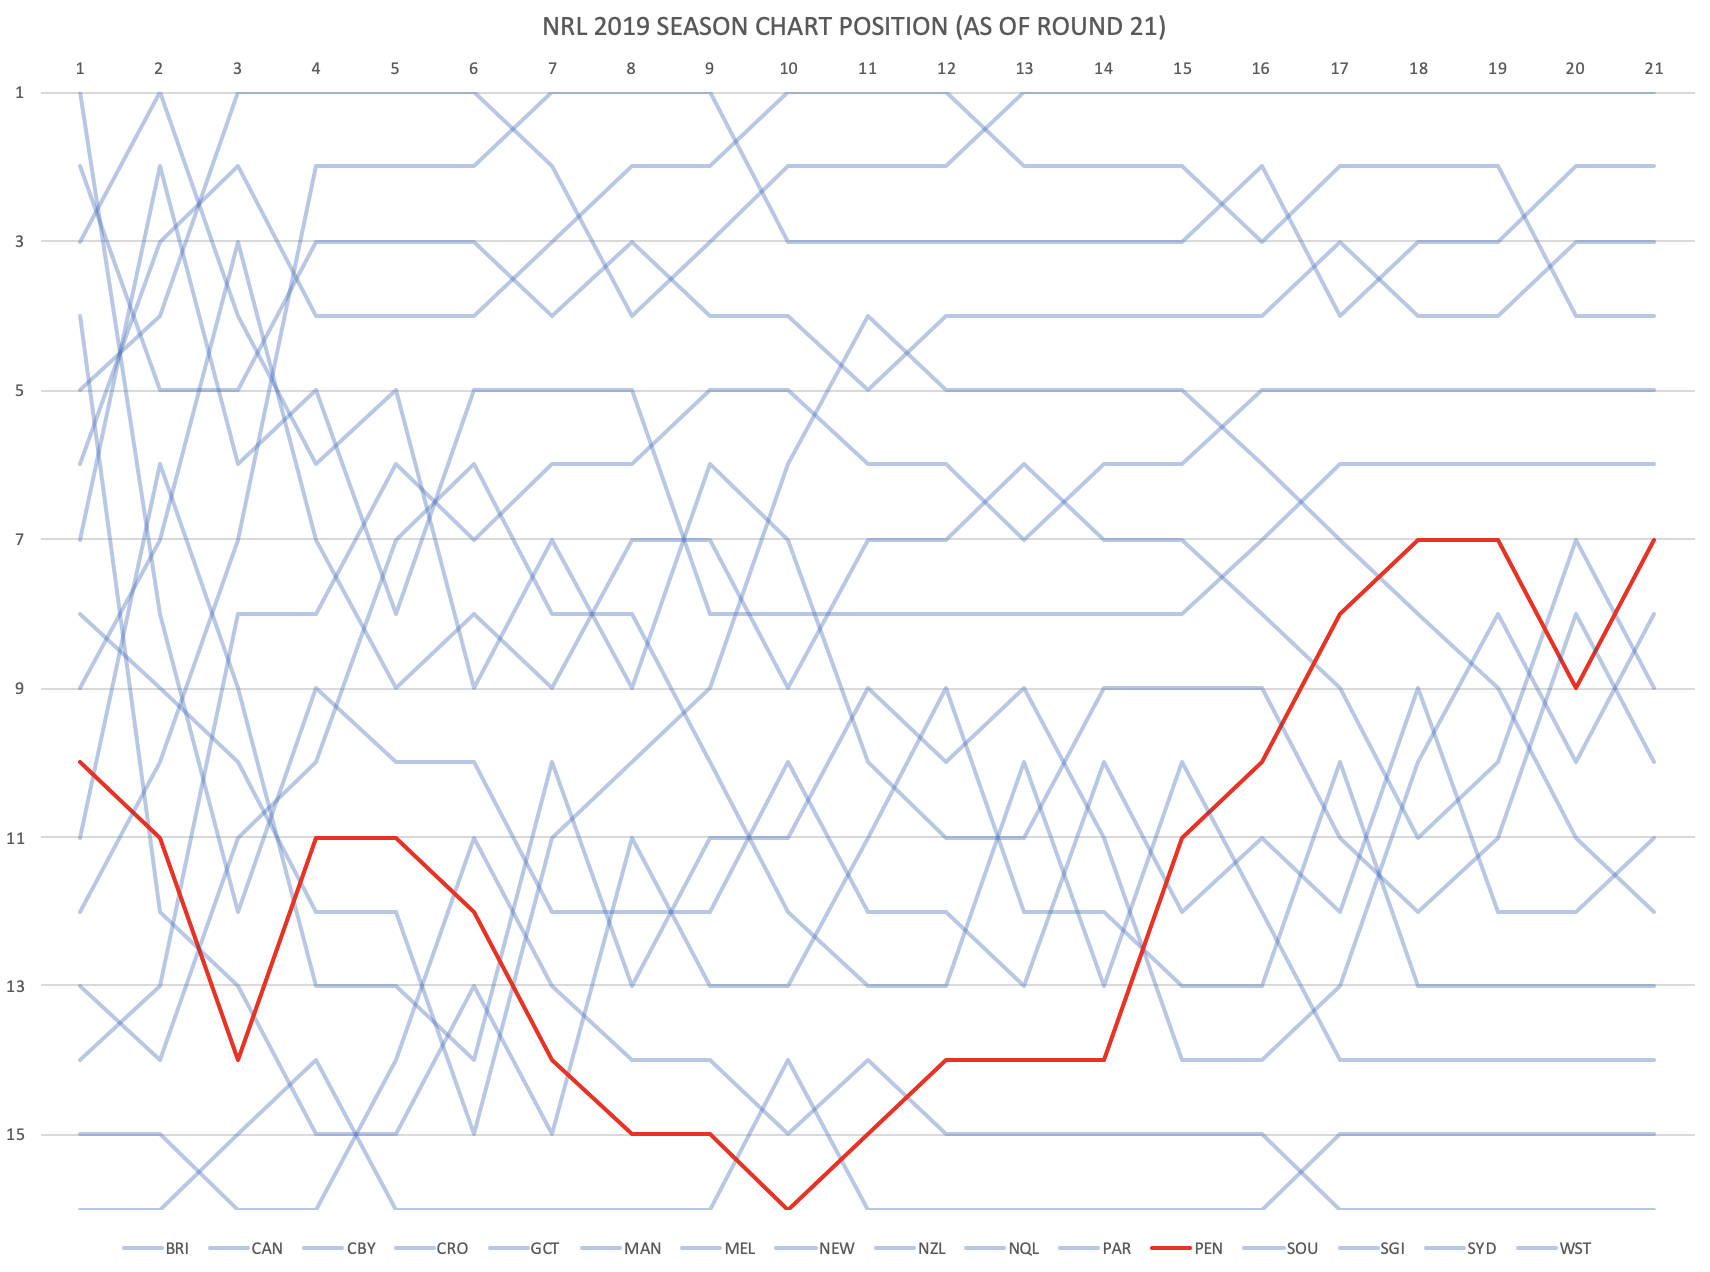
I was just getting some data together for the website, and I thought I would share it with you to get a idea of how the Panthers season was all but over in Round 10 and the recovery since. Interesting where the Panthers are positioned now is the highest they have reached this year (which is quite impressive considering the 2-8 start).
The table below is the Round-by-Round breakdown of each teams positions and the graph below is the Panthers season highlighted visually on the backdrop of the other teams performance.
| TEAM | 1 | 2 | 3 | 4 | 5 | 6 | 7 | 8 | 9 | 10 | 11 | 12 | 13 | 14 | 15 | 16 | 17 | 18 | 19 | 20 | 21 |
|---|---|---|---|---|---|---|---|---|---|---|---|---|---|---|---|---|---|---|---|---|---|
| Broncos | 11 | 6 | 9 | 13 | 13 | 14 | 10 | 13 | 11 | 11 | 9 | 10 | 9 | 11 | 14 | 14 | 13 | 10 | 8 | 10 | 8 |
| Raiders | 2 | 5 | 5 | 3 | 3 | 3 | 4 | 3 | 4 | 4 | 5 | 4 | 4 | 4 | 4 | 4 | 3 | 4 | 4 | 3 | 3 |
| Bulldogs | 16 | 16 | 15 | 14 | 16 | 16 | 16 | 16 | 16 | 14 | 16 | 16 | 16 | 16 | 16 | 16 | 15 | 15 | 15 | 15 | 15 |
| Sharks | 9 | 7 | 3 | 7 | 9 | 8 | 9 | 7 | 7 | 9 | 7 | 7 | 6 | 7 | 7 | 8 | 9 | 11 | 10 | 7 | 9 |
| Titans | 15 | 15 | 16 | 16 | 14 | 11 | 13 | 14 | 14 | 15 | 14 | 15 | 15 | 15 | 15 | 15 | 16 | 16 | 16 | 16 | 16 |
| Sea Eagles | 14 | 13 | 8 | 8 | 6 | 7 | 6 | 6 | 5 | 5 | 6 | 6 | 7 | 6 | 6 | 5 | 5 | 5 | 5 | 5 | 5 |
| Storm | 5 | 4 | 1 | 1 | 1 | 1 | 2 | 4 | 3 | 2 | 2 | 2 | 1 | 1 | 1 | 1 | 1 | 1 | 1 | 1 | 1 |
| Knights | 8 | 9 | 10 | 12 | 12 | 15 | 11 | 10 | 9 | 6 | 4 | 5 | 5 | 5 | 5 | 6 | 7 | 8 | 9 | 11 | 12 |
| Warriors | 1 | 8 | 12 | 9 | 10 | 10 | 12 | 12 | 12 | 10 | 12 | 12 | 13 | 10 | 12 | 11 | 12 | 9 | 12 | 12 | 11 |
| Cowboys | 4 | 12 | 13 | 15 | 15 | 13 | 15 | 11 | 13 | 13 | 11 | 9 | 12 | 12 | 13 | 13 | 10 | 13 | 13 | 13 | 13 |
| Eels | 7 | 2 | 6 | 5 | 8 | 5 | 5 | 5 | 8 | 8 | 8 | 8 | 8 | 8 | 8 | 7 | 6 | 6 | 6 | 6 | 6 |
| Panthers | 10 | 11 | 14 | 11 | 11 | 12 | 14 | 15 | 15 | 16 | 15 | 14 | 14 | 14 | 11 | 10 | 8 | 7 | 7 | 9 | 7 |
| Rabbitohs | 6 | 3 | 2 | 4 | 4 | 4 | 3 | 2 | 2 | 1 | 1 | 1 | 2 | 2 | 2 | 3 | 2 | 2 | 2 | 4 | 4 |
| Dragons | 13 | 14 | 11 | 10 | 7 | 6 | 8 | 8 | 10 | 12 | 13 | 13 | 10 | 13 | 10 | 12 | 14 | 14 | 14 | 14 | 14 |
| Roosters | 12 | 10 | 7 | 2 | 2 | 2 | 1 | 1 | 1 | 3 | 3 | 3 | 3 | 3 | 3 | 2 | 4 | 3 | 3 | 2 | 2 |
| Tigers | 3 | 1 | 4 | 6 | 5 | 9 | 7 | 9 | 6 | 7 | 10 | 11 | 11 | 9 | 9 | 9 | 11 | 12 | 11 | 8 | 10 |